Overview
Learn what QMonitor is and how it can help you.
What is QMonitor?
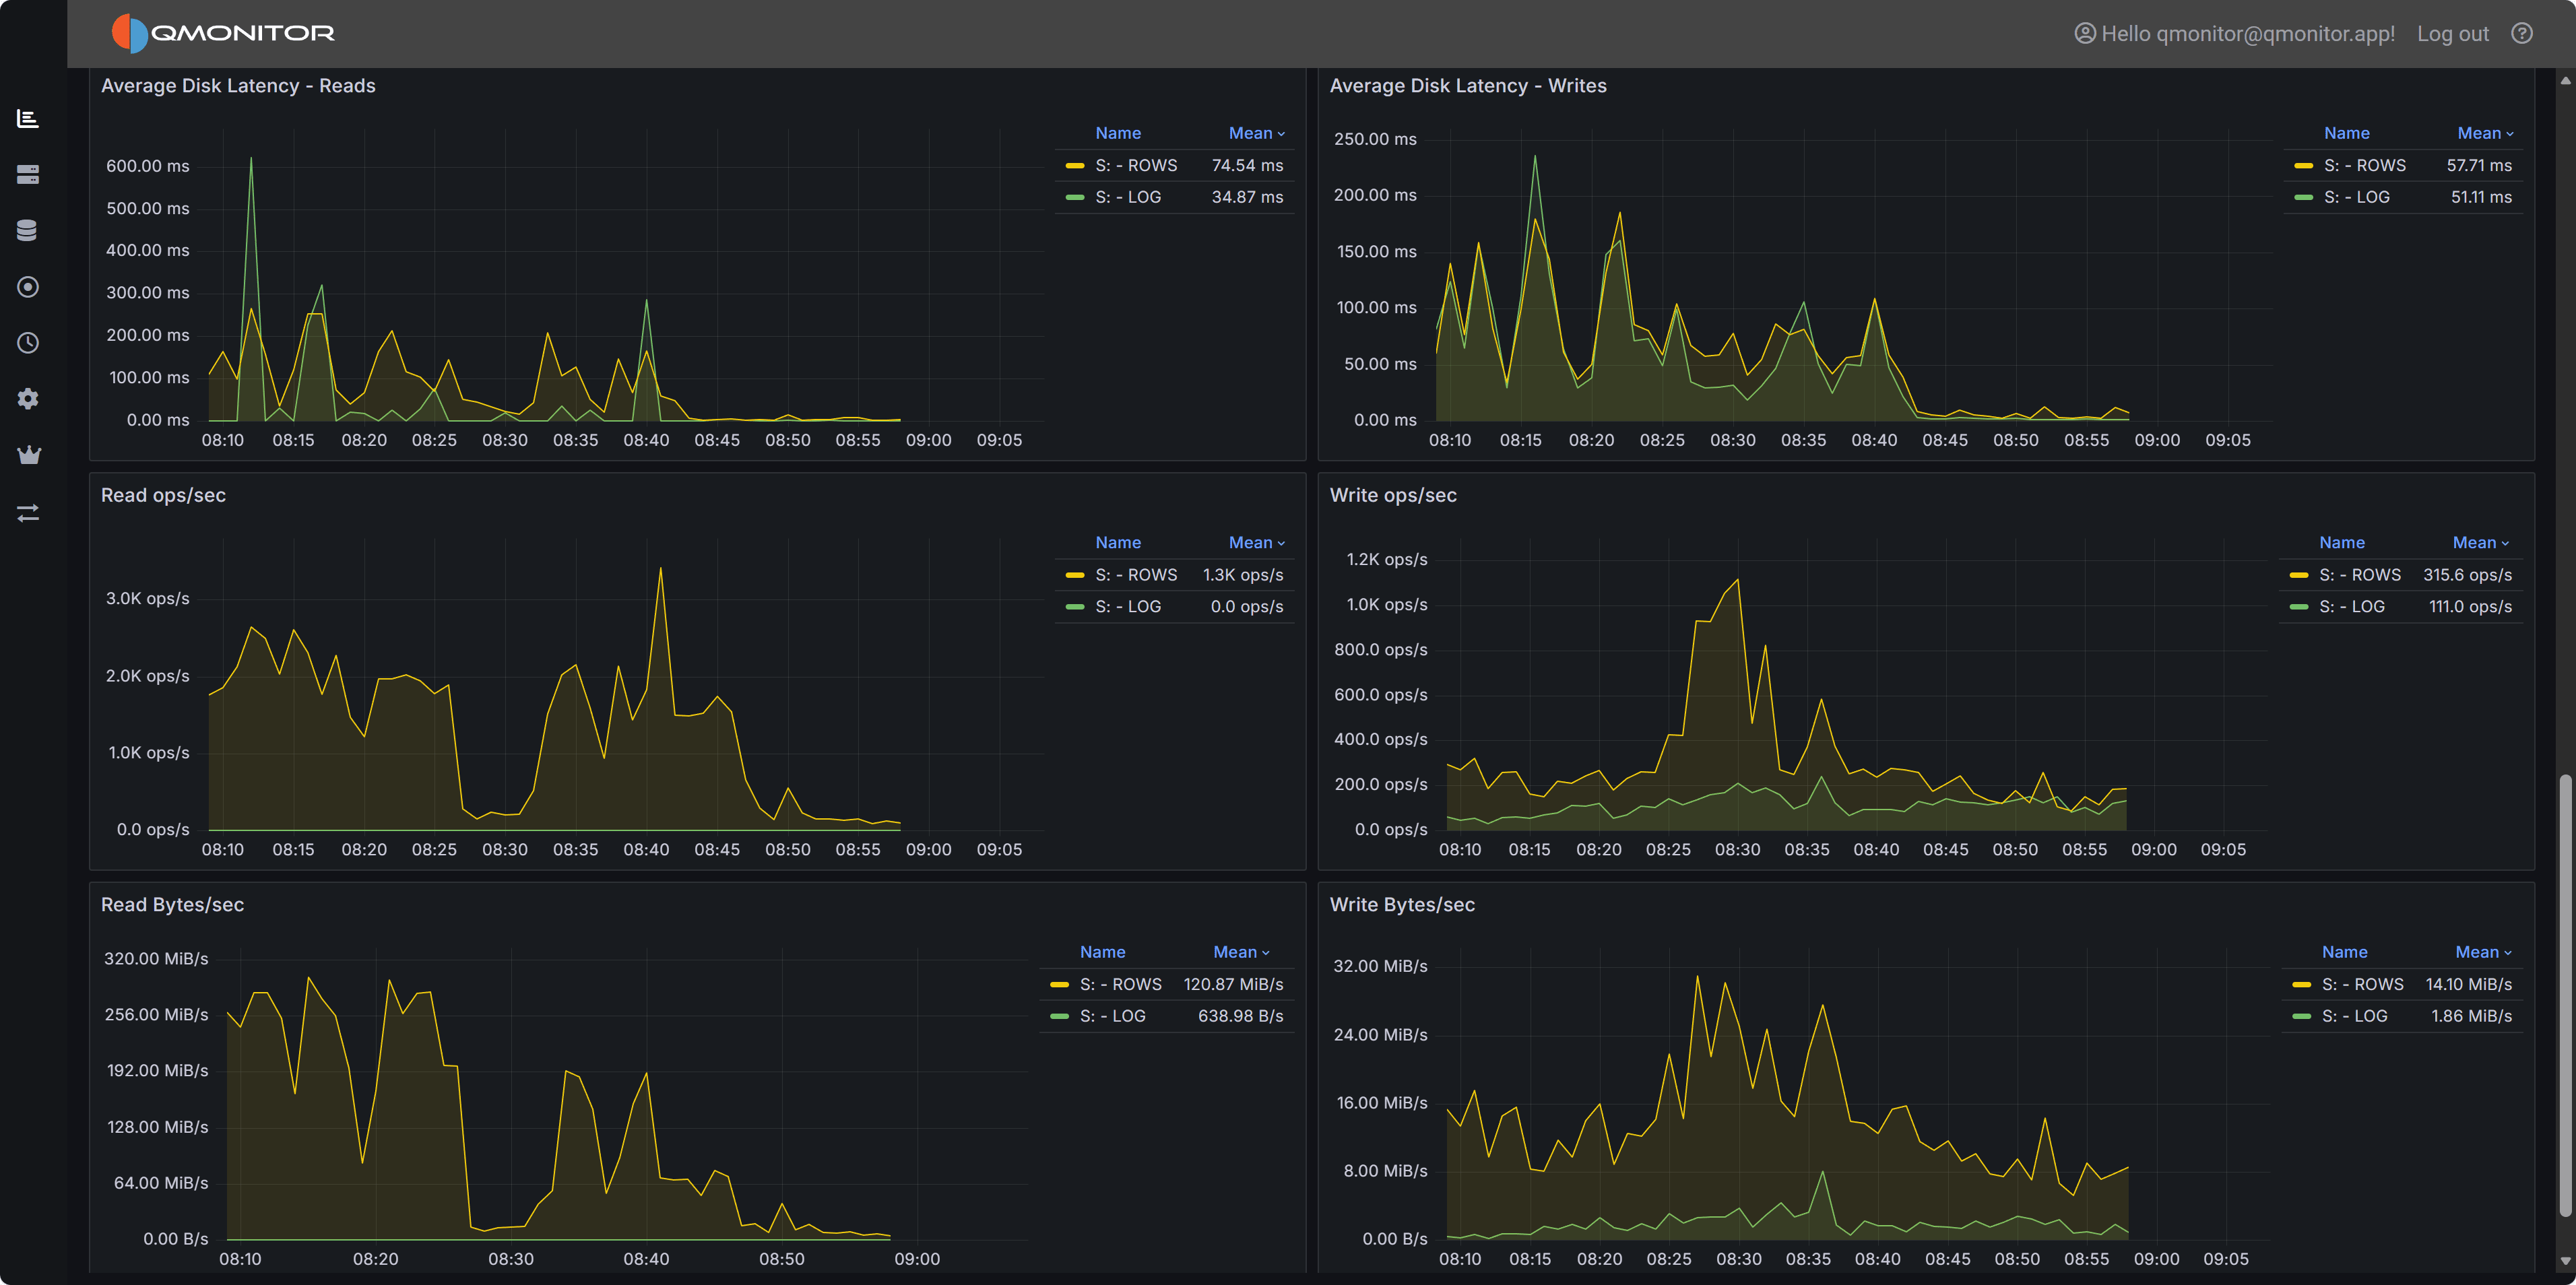
QMonitor is a monitoring solution for SQL Server. It collects performance metrics and health data from your SQL Server instances and displays them in easy-to-read dashboards.
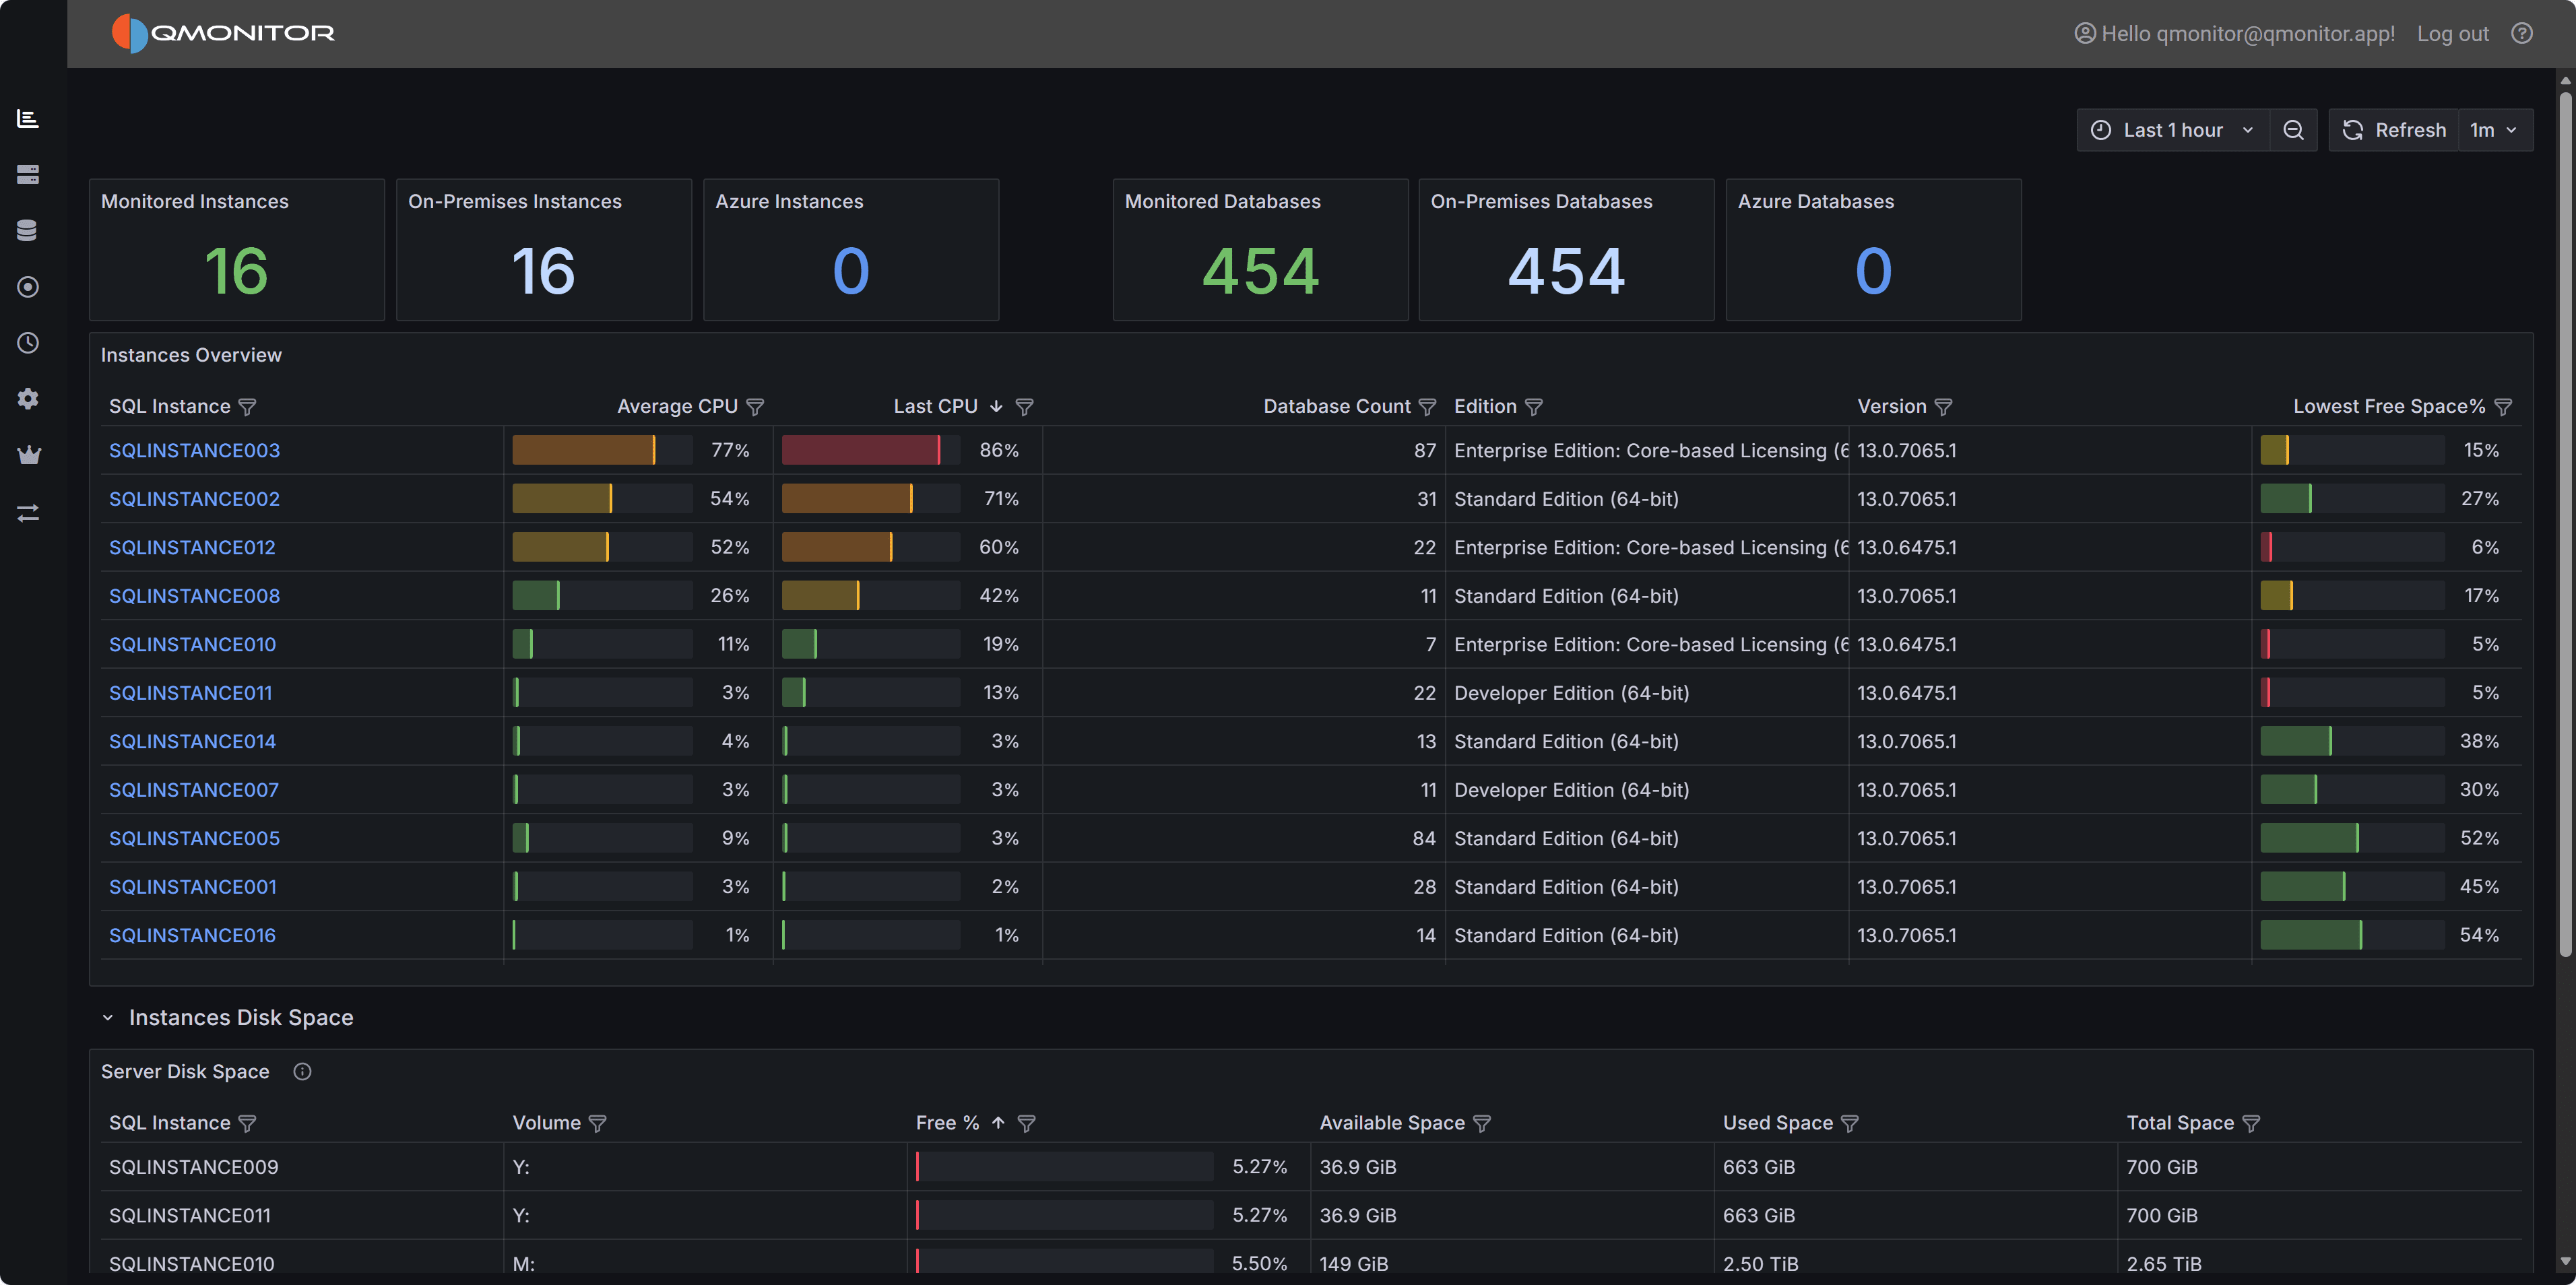
QMonitor helps you:
- Track SQL Server performance over time
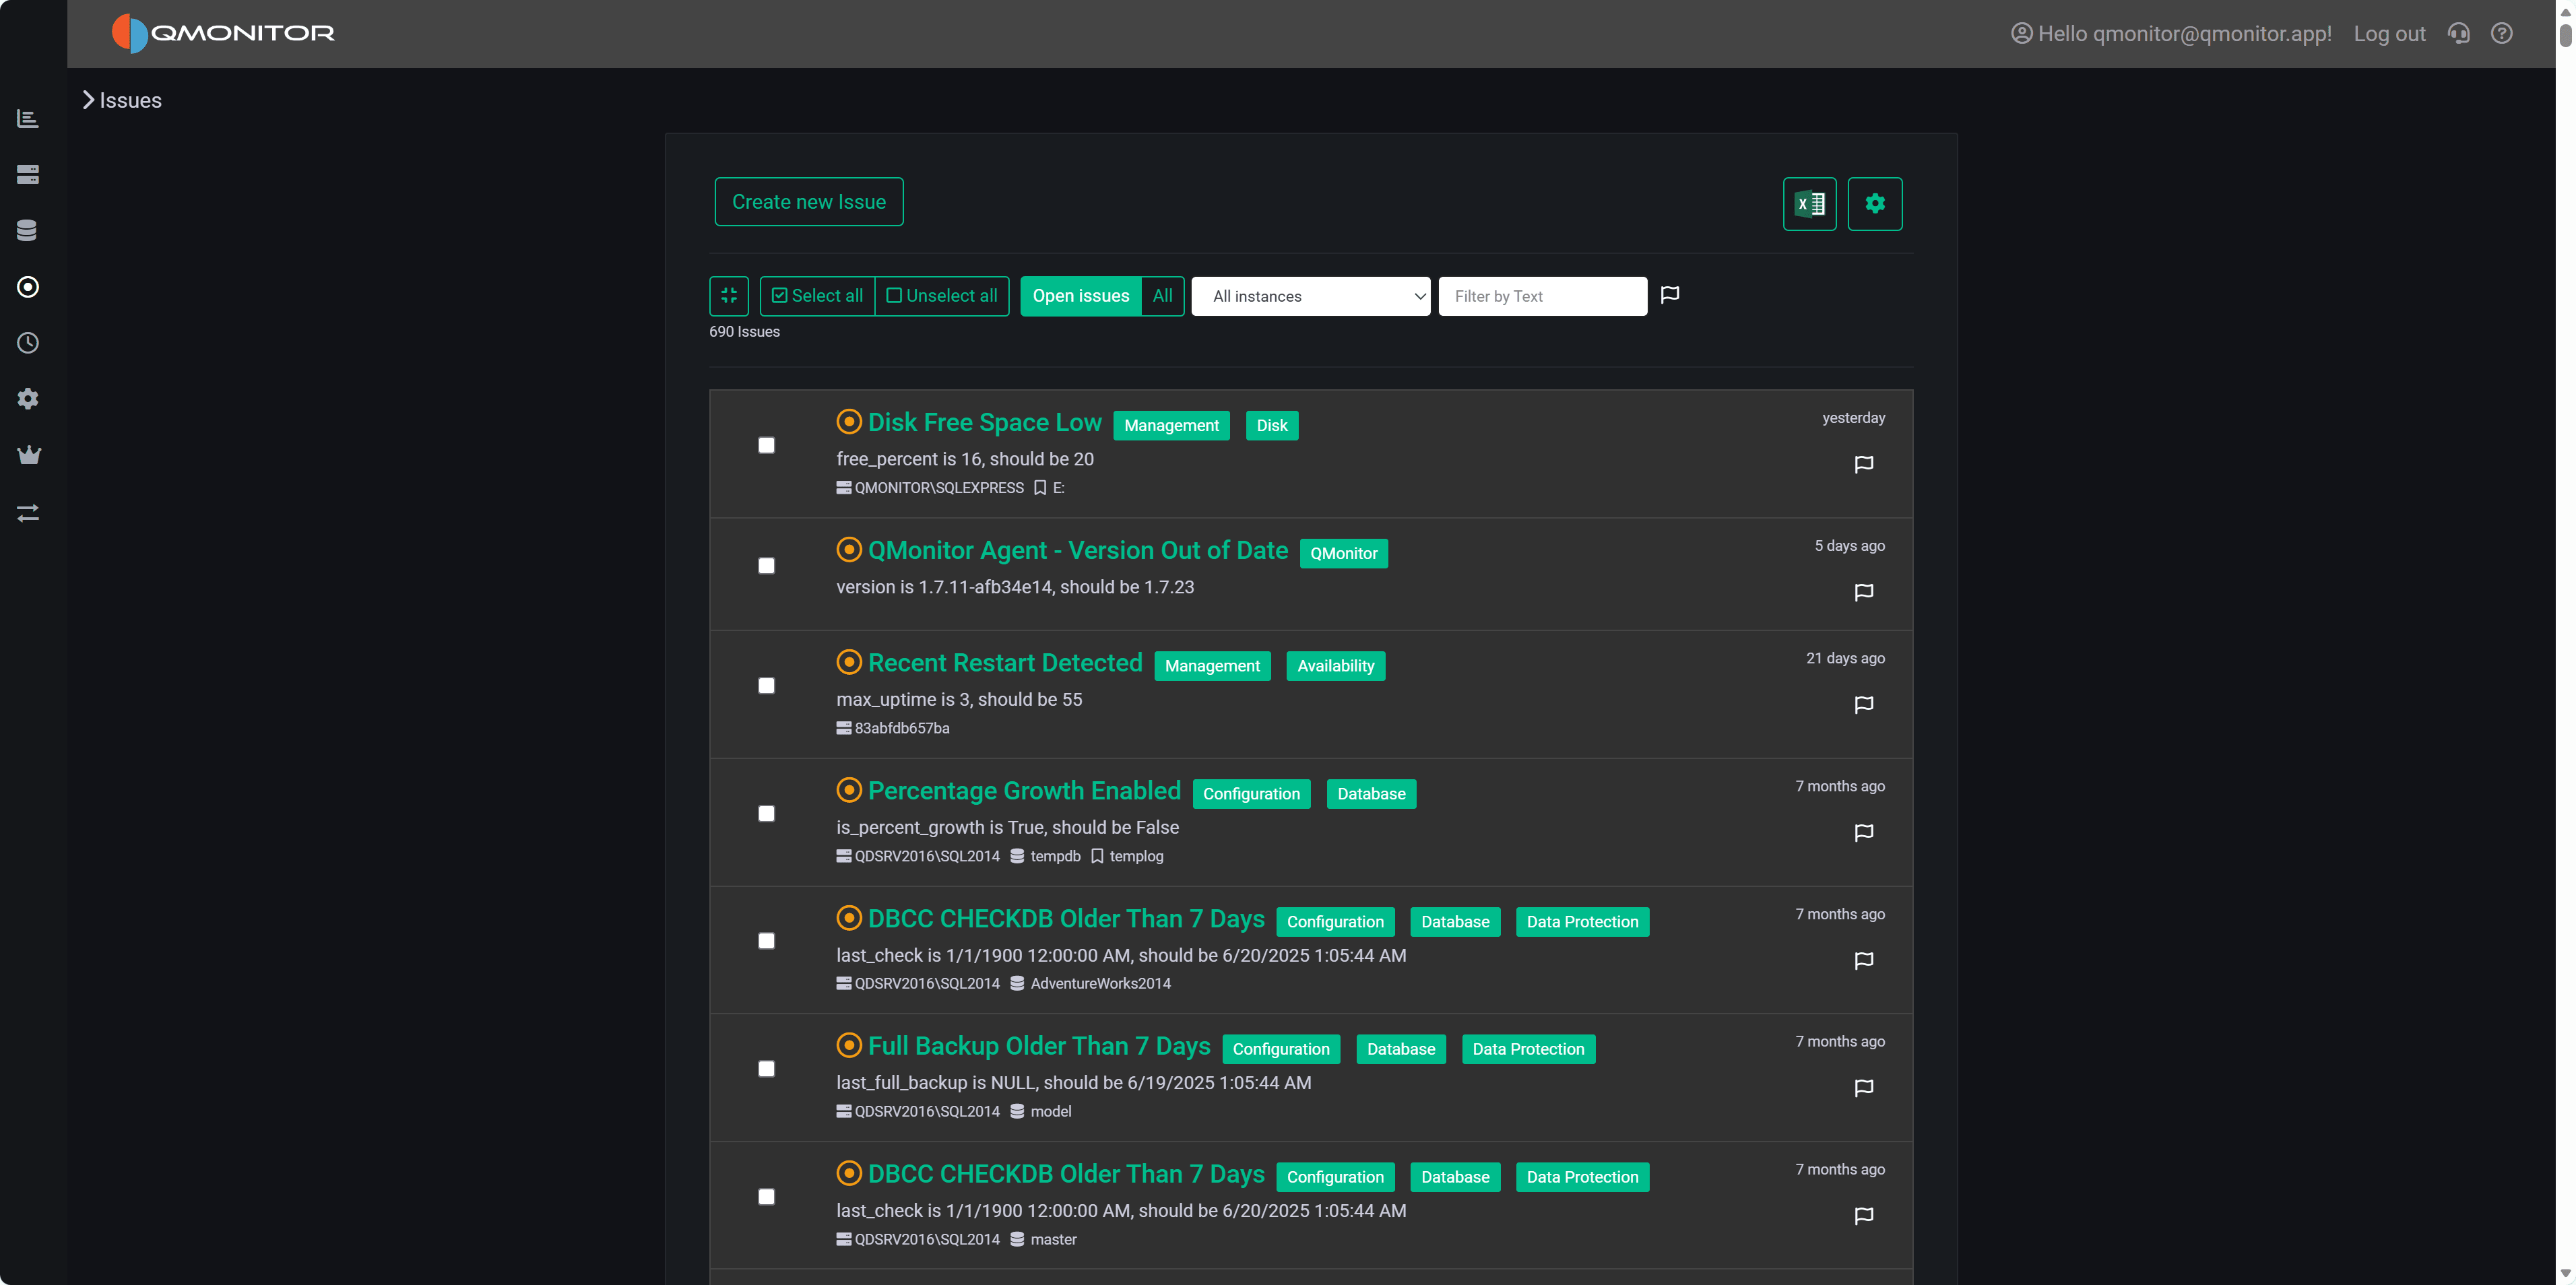
- Identify problems before they affect users
- Analyze query performance and resource usage
- Monitor SQL Server Agent jobs
- Review blocking, deadlocks, and errors
Why Use QMonitor?
Good for:
- Monitoring multiple SQL Server instances from one place
- Tracking performance trends and capacity planning
- Getting alerts when problems occur
- Analyzing slow queries and high resource usage
- Monitoring Always On availability groups
- Tracking the outcome and duration of SQL Server Agent jobs
- Documenting instances and databases in your environment
Coming soon:
- Custom dashboards and visualizations
- Oracle and PostgreSQL monitoring
- AI assisted query optimization
- AI assisted incident analysis
Where Should I Go Next?
Ready to get started? Here are your next steps:
- Getting Started: Set up your first monitored instance
- Concepts: Learn key terms and how QMonitor works
- Core Tasks: Follow step-by-step guides for common tasks